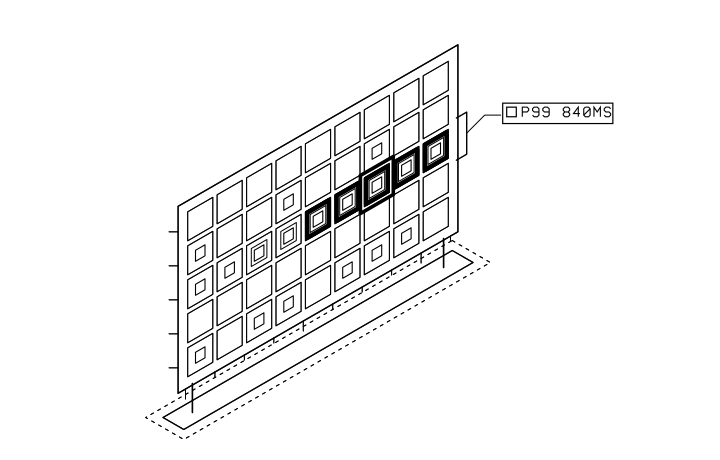
Latency heatmap
Cells warm where requests are slow, and the hottest route is flagged with its p99.
Not quite it? Ask for a variation
Install
Writes one React component into components/illos. Nothing else to install.
npx shadcn@latest add https://illos.dev/r/scifi/latency-heatmap.jsonOr hand it to your agent
Claude Code, Cursor, Codex and any other coding agent can add it from the prompt.
How it moves
- requests fill a grid of cells by route and time.
- cells warm where requests are slow.
- the hottest route is flagged with its p99.
For developers
- File size
- 2.9 KB gzipped
- Motion
- Plays once, 3.0 s, then holds
- Reduced motion
- Shows a still
- File
- latency-heatmap.svg